Based on the molecular analysis of your buccal swab sample, we report your nutritional molecular score. This score symbolizes an overall molecular assessment of your nutritional status. The higher the score, the more healthy is your nutritional profile.
For your personal Nutrition Molecular Q-Score, three weighted scores are used. These reflect how your individual proteomic profile compares to healthy (blue), intermediate (gray) or unhealthy (red) nutritional markers. Moreover, the score considers other valuable factors from your proteome to reflect a wide analysis of your overall nutritional health
Your profile displays the highest similarity to the unhealthy nutritional category.
Based on your nutritional status, we show you how your nutritional profile compares to others and where you stand within the tested population.
The figure shows where you stand in relation to other people. The number of people represents the distributions in relation to the population tested. You are highlighted in colour in the graph.
Often, people are subjective with how they perceive their diet which makes it difficult to improve their habits. Per main nutritional component, we estimate your intake based on the molecular readout and thereby provide you the possibility to validate important aspects of a balanced diet. You can also take this information to adjust your diet and its particular component.
unhealthy
moderate
healthy
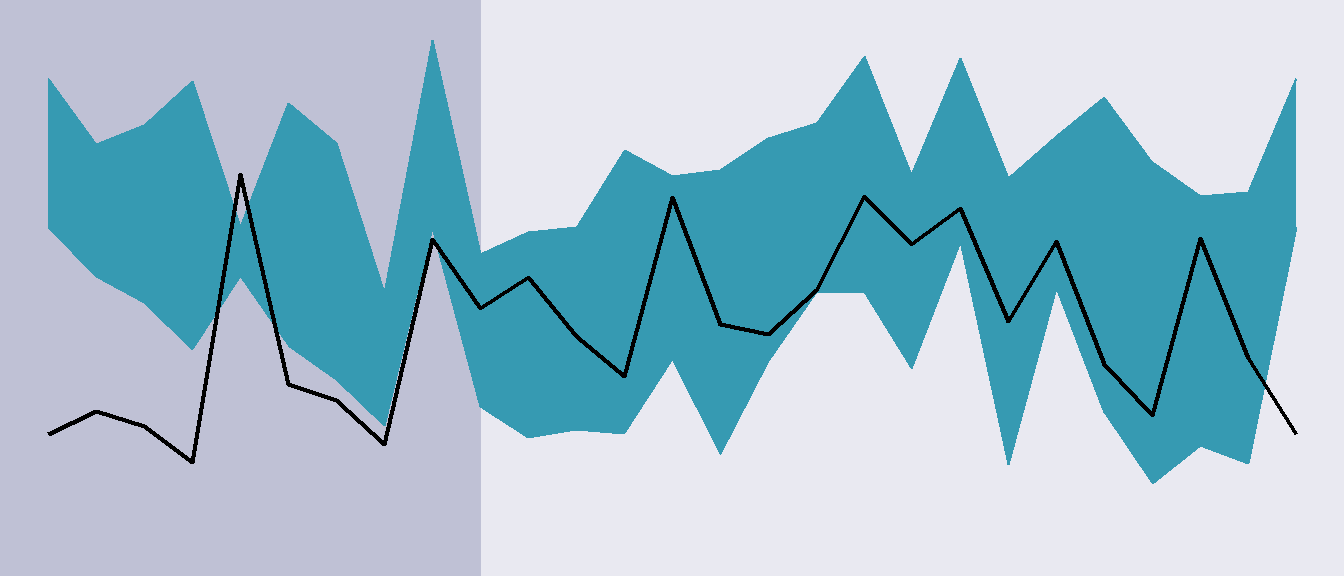
Now let’s get some actionable advice. Therefore, we take a look if your nutritional markers (black line) fall in the healthy range (blue ribbon). By doing so, it reveals how much effort you need to put to get or stay in the healthy category.
For the section in which your nutritonal markers do not fall in the healthy range, we provide you with individual suggestions on how you can improve your diet on a daily and weekly basis. Realistic changes will lead to change of lifestyle in the long term which is the basis for a healthy life.
| 37.0% of markers are not in the healthy range |
63.0% of markers are in the healthy range |
|
|
|
|
| Sugary drinks |
|---|
| Your current status | Your next step |
|---|
| 1-3 per week | Rarely |
|---|
| Water |
|---|
| Your current status | Your next step |
|---|
| 3 and more | |
|---|
| Freshly prepared meat |
|---|
| Your current status | Your next step |
|---|
| Once per day | 4-6 per week |
|---|
| Processed meat products |
|---|
| Your current status | Your next step |
|---|
| 1-3 per week | Rarely |
|---|
| Fish or sea products |
|---|
| Your current status | Your next step |
|---|
| 1-3 per week | |
|---|
| Vegetables |
|---|
| Your current status | Your next step |
|---|
| Once per day | Many times per day |
|---|
| Fruits |
|---|
| Your current status | Your next step |
|---|
| 1-3 per week | 4-6 per week |
|---|
| Grains and seeds |
|---|
| Your current status | Your next step |
|---|
| 1-3 per week | 4-6 per week |
|---|
| Starchy food |
|---|
| Your current status | Your next step |
|---|
| 1-3 per week | |
|---|
| Milk products |
|---|
| Your current status | Your next step |
|---|
| 4-6 per week | |
|---|
| Fast food |
|---|
| Your current status | Your next step |
|---|
| 1-3 per week | Rarely |
|---|
| Snacks |
|---|
| Your current status | Your next step |
|---|
| 4-6 per week | 1-3 per week |
|---|
| Sweets |
|---|
| Your current status | Your next step |
|---|
| 1-3 per week | Rarely |
|---|
